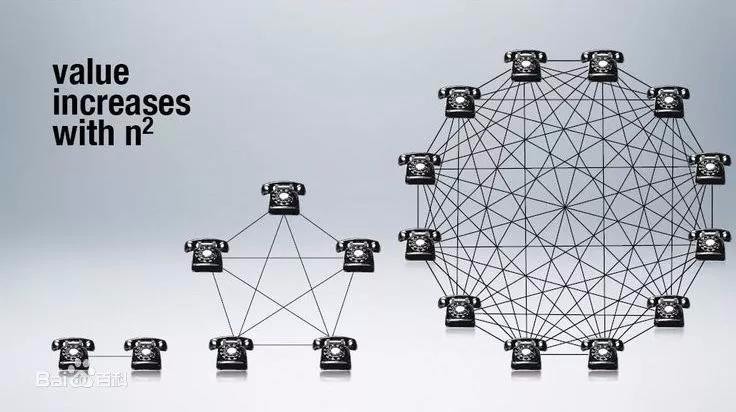
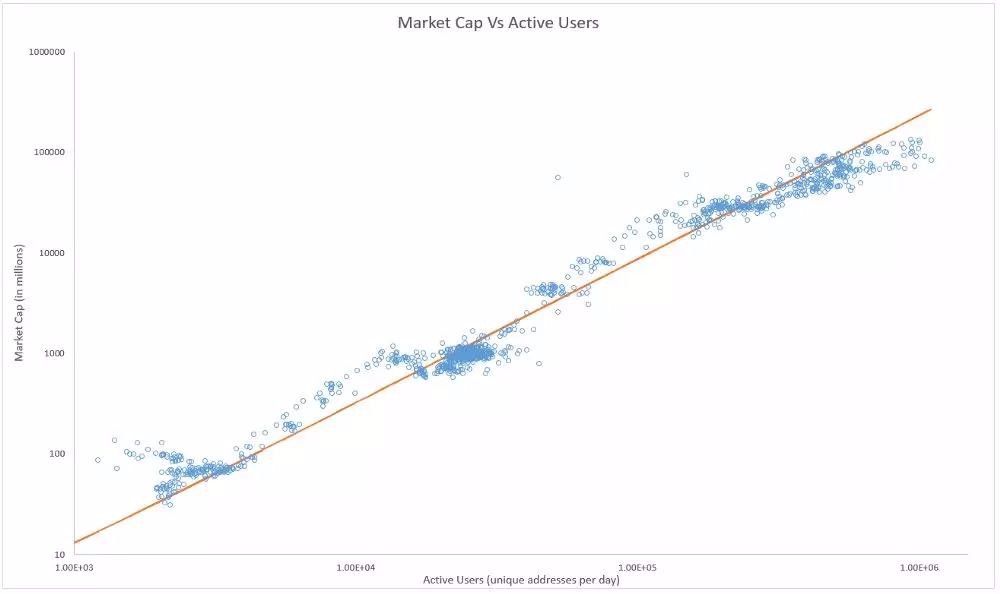
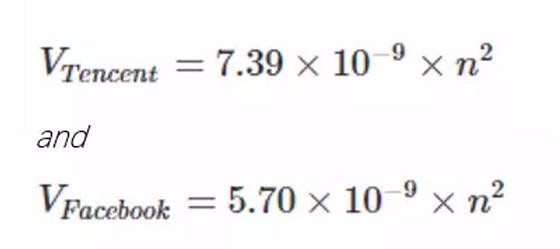
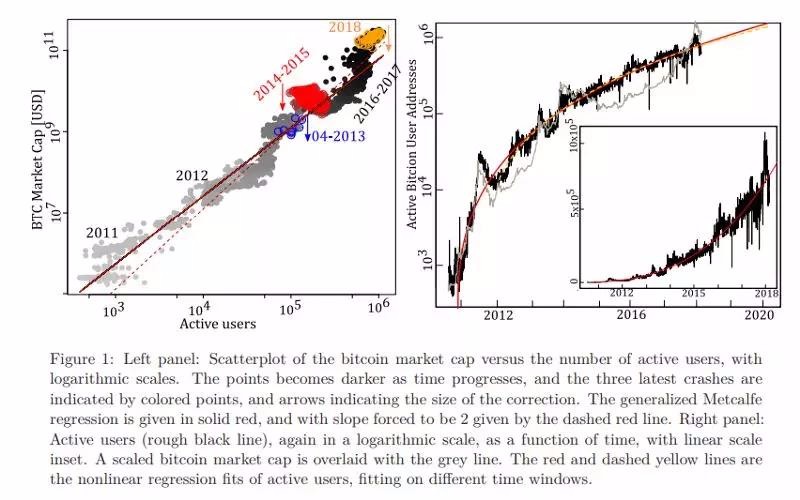
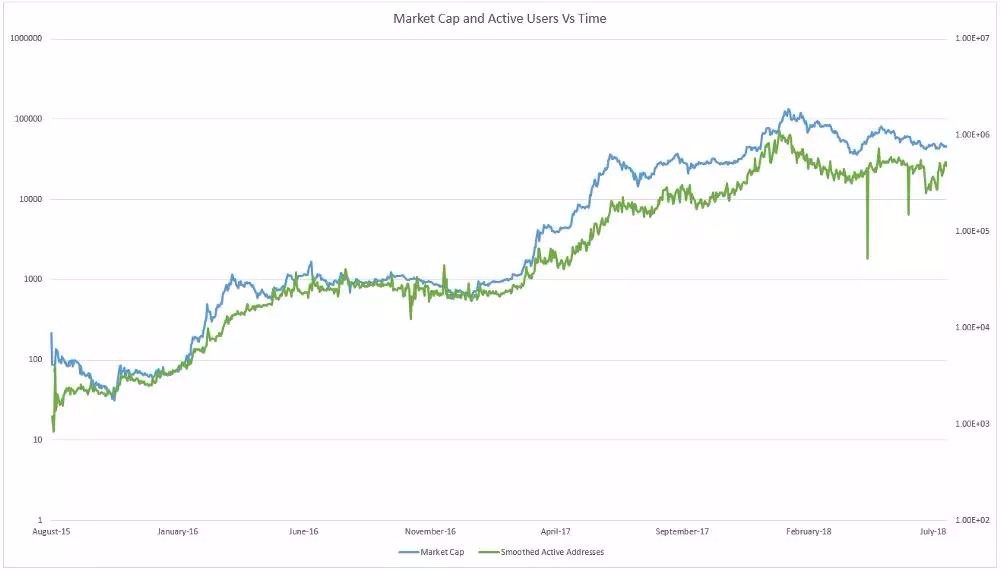
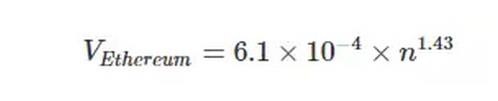
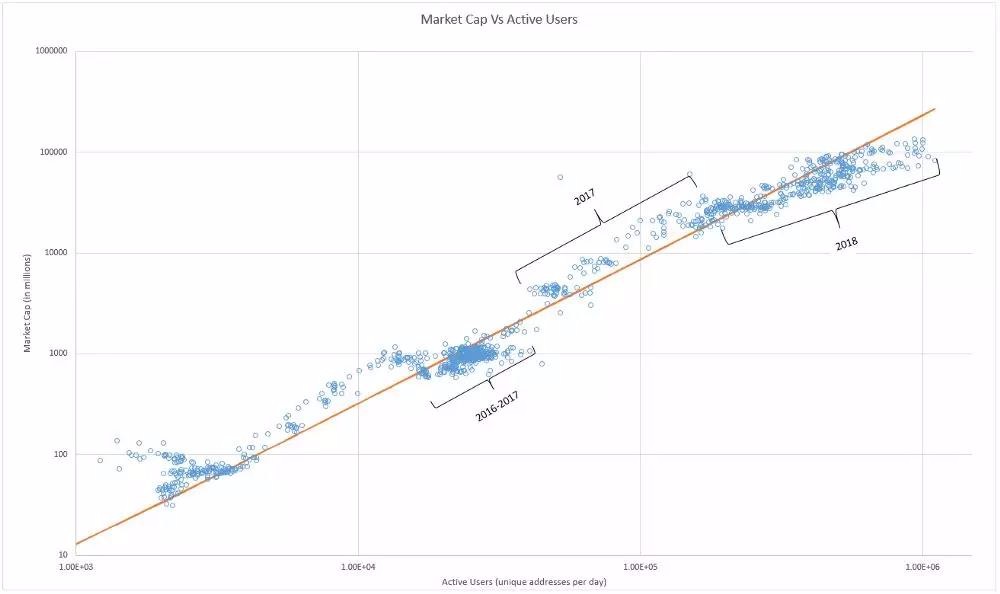
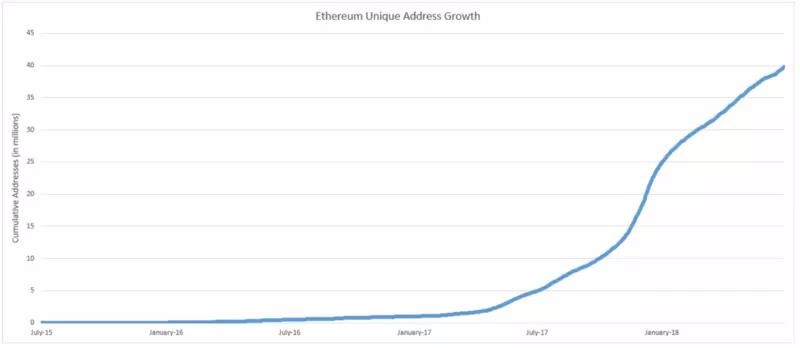
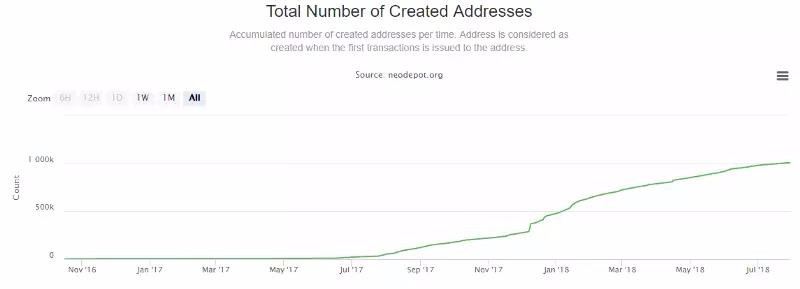
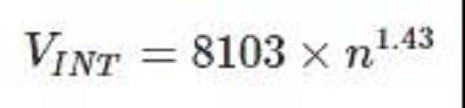
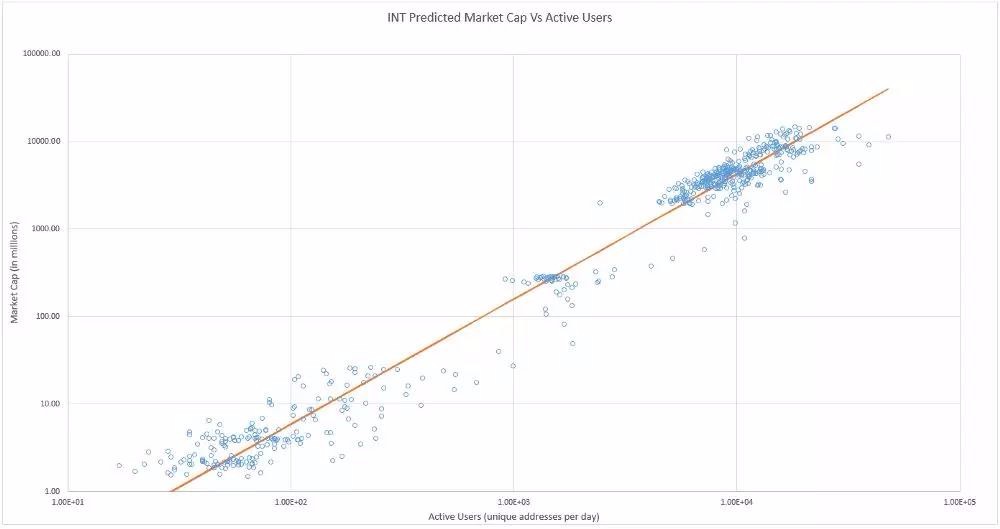
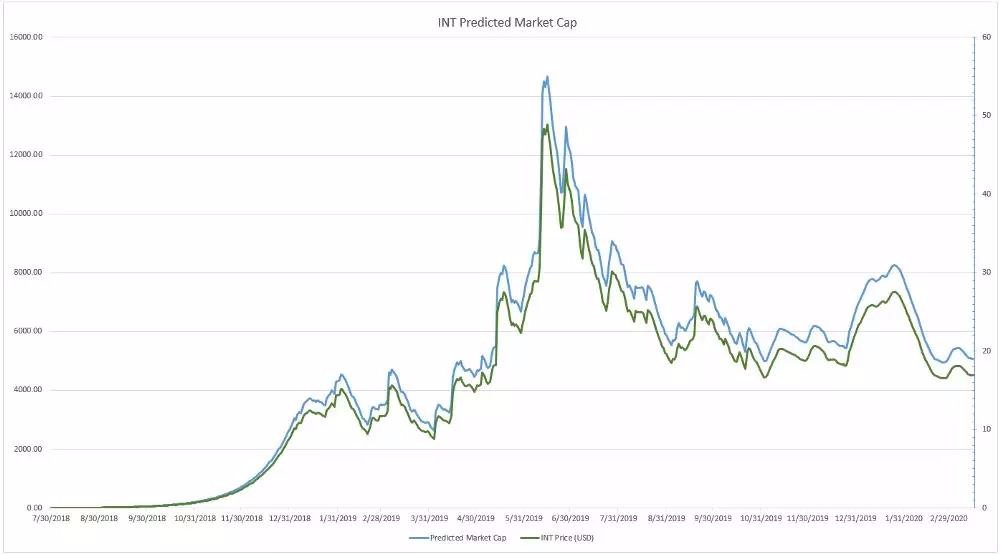
Theoretical Value of INT — Metcalfe’s Law The Embodiment of the Network Effect INT的理论价值——梅特卡夫定律 网络效应的体现 作者简介 美国波音公司工业工程师,笔名“Graytrain”,是区块链和加密货币的忠实拥护者。他致力于将复杂的区块链技术简单化,以便大众更好地学习和理解。他对区块链技术深入的解读,使得他的文章在海外一直备受好评,拥有众多忠实的粉丝。 Please be aware that this is a value prediction article and is therefore entirely speculative in nature. While statistical mathematical methods are used, the values shown are for exercise only and may never be realized. 注意:这是一篇有关价值预测的文章,本身带有投机性。 尽管该文章应用了统计数学方法,但其所示的价值仅用于尝试,有可能并不会实现。 I recently came across an article from MIT Technology Review titled How Network Theory Predicts the Value of Bitcoin. Now I am well aware of Technical Analysis and the hand-wavy techniques used to “determine” market trends and future price and I generally try to steer away from such speculation as they are often wrong as many times as they are right. So when MIT published an article saying they were able to predict 94% of Bitcoin price movement using Metcalfe’s law, my interest was piqued. I figured it would be an interesting exercise to use it to look at the impact of predicted future IoT network growth. 最近我阅读了一篇麻省理工学院技术评论的文章,名为《网络理论如何预测比特币的价值》。 它让我清楚认识到什么是用于“确定”市场趋势和未来价格的技术分析以及手工波浪技术,而以前的我通常会刻意避开这种猜测,以为它们的错误次数和正确次数一样多。 因此,当麻省理工学院发表的这篇文章说他们能够使用梅特卡夫定律预测94%的比特币价格变动时,我对此十分好奇,同时我认为用它来观察预测的未来物联网网络的增长所能够产生的影响将是一个有趣的实验。 Overview 概述 First introduced in 1980, and attributed to Robert Metcalfe (co-inventor of Ethernet), the law states that the value of a network (V) is proportional to the square of the number of connected users of the system (n²). This first was applied to not users, but compatible connected devices like fax machines and phones in the days before the Internet. 由1980年Robert Metcalfe(以太网的共同发明者)推出的定律所述,网络的值(V)与系统的连接用户数(n²)的平方成正比。第一个并非应用于用户,而是传真机和电话等兼容的连接设备,此时互联网还并未形成。 Put simply, the more people use a network, the more valuable it is. If a network is composed of 2 computers, it has less value than one with 10 computers and lesser still than one of 50 computers. It turns out that the increase in value grows faster than the growth of the network. 简而言之,网络使用人数越多,它就越有价值。如果一个网络由两台计算机组成,它的价值就会低于一台由10台计算机组成的网络,同理,由50台计算机中的网络价值则更高。 事实证明,价值的增长比网络的增长更快。 This assumes that each user or device is of equal value which in certain cases may not be true. If one fax machine serves 50 people in a workplace, the value of that one machine is higher than that of one that serves only 2. 假设每个用户或设备价值相等,而该假设在某些情况下是无法成立的。如果一台办公传真机为50个用户服务,则该传真机的价值高于仅服务2个用户的传真机。 It is important to note here that it is not equal to the number of users but proportional to the number of users by a Metcalfe’s coefficient (a) that has to be empirically found for a given network. This coefficient approaches stability the larger the n. Metcalfe’s law then becomes: 值得注意的是,价值不直接等于用户数,而是与Metcalfe系数(a)的用户数成正比,该系数(a)必须从既定网络中以观察或实验为依据而确定。 n越大,该系数越接近稳定性。那么梅特卡夫定律为: Proving the validity of this proposed law has only been a possibility with the recent growth of social media and large scale data sets. The most significant of which was an independent study (Zhang et al., 2015) on the value of Facebook and Tencent, China’s largest social network company. They found that over a 10 year period, the value of these companies grew not linearly with the growth of the user base but as the square as predicted by Metcalfe’s law. They reported a Metcalfe’s function for Tencent and Facebook of: 随着最近社交媒体和大规模数据集的增长,想要证明这一定律的并不难。其中最重要的是关于Facebook和中国最大社交网络公司腾讯的价值的独立研究(Zhang et al.,2015)。他们发现,在10年的时间里,这些公司的价值与用户群的增长并不是线性增长,而是与梅特卡夫定律预测的平方。他们总结了腾讯和Facebook的梅特卡夫功能分别为: Metcalfe’s Law in Cryptoeconomies 加密货币领域的梅特卡夫定律 More recently, cryptocurrencies have drawn the attention of curious network scientist and financial experts as the dawn of a new internet of value approaches. These networks present another interesting case of large, ever-growing user base with a network of known market value. 最近,加密货币引起了网络科学家和金融专家的好奇与关注,随着新兴网络的价值曙光开始显现。这些网络提供了另一个有趣的案例,即在已知市场价值的网络中的大型且不断增长的用户群。 Bitcoin比特币 Several economists from ETH Zurich and the Swiss Finance Institute released a paper in March of this year which used Metcalfe’s law to predict bitcoin’s bubbles and crashes (Wheatly et al., 2018). They outline in great detail how they went about constructing this model for bitcoin valuation using daily active users by counting unique addresses used in a given day. Plotting market capitalization versus active users reveals a remarkable correlation between the two and when fit with a line formulated by Metcalfe’s law, collections of points above the line correspond to times before crashes and points below the line correspond to times of buying opportunity [Fig. 1]. (remember linear in log scale means exponential in linear scale) 来自苏黎世联邦理工学院和瑞士金融学院的几位经济学家在今年3月发表了一篇论文,该论文使用梅特卡夫定律来预测比特币的泡沫和碰撞(Wheatly et al.,2018)。他们非常详细地阐述了如何在固定时间内利用每日活跃用户的唯一地址来构建此比特币评估模型。 通过绘制市值与活跃用户之间的关系图,显示出两者之间存在强烈的联系。当符合梅特卡夫定律形成的线时,线上方点的集合对应于崩溃前的时间,线下的点对应于购买机会的时间[图1]。(注意对数刻度线性意味着指数线性刻度) Fig. 1 Taken directly from Wheatly et al., 2018 “Are Bitcoin Bubbles Predictable? Combining a Generalized Metcalfe’s Law and the LPPLS Model” 图1直接取自比Wheatly et al., 2018《比特币泡沫是否可预测?结合广义梅特卡夫定律和对数周期幂律奇点(Log-Periodic Power Law Singularity 简称LPPLS)模型》 As shown in the chart on the right, the growth of daily active users of the network correlates almost perfectly to the market cap at that time. This is remarkable. This is the only example I could find of hard data that correlates to value of a cryptocurrency. I couldn’t stop here, I had to try it for myself. So I pulled the data for Ethereum from Etherscan. 如右图所示,网络日常活跃用户的增长几乎与当时的市值完全相关。 这太了不起了。但却是目前我能找到的与加密货币价值相关的硬数据的唯一例子。我不能就此停下搜集的脚步,哪怕是为了我自己。因此,我从Etherscan中提取了以太坊的数据。 Ethereum以太坊 Now we can expect to not see as great of a fit because there was some expected valuation at the start of this project and so it’s market cap didn’t grow naturally from zero like it did with bitcoin. Also we don’t have the same timelines to deal with so sample size is not as big. Putting the data together and correlating it like was shown in the study above, we see the same relationships. Charting the active users of the network over time with the market cap overlaid we can see the remarkably direct correlation between the two [Fig. 2]. Action in user activity directly results in corresponding market valuation movement. 现在我们不用期待以太坊会十分适合于以上理论,因为在这个项目开始时有一些预期的估值,所以它的市值并没有像比特币一样自然地从零增长。 此外,我们没有相同的时间表来处理,因此样本量不是那么大。 正如上面的研究中所示方法,我们将数据汇集并将其关联,那么就看到了相同的关系。随着时间的推移,在市值覆盖的情况下绘制网络的活跃用户,我们可以看到两者之间的显着直接相关性[图2]。用户活动中的行动直接导致相应的市场估值变动。 Fig. 2 Ethereum market capitalization and active users in logarithmic scale, as a function of time. The direct correlation between activity growth and market cap shown. 图2 以太币市场资本化和对数尺度的活跃用户,作为时间的函数,显示了活跃度增长与市值之间的直接关联。 Charting market capitalization versus daily active users shows a linear in log relationship that can be fit with a formula based on Metcalfe’s law [Fig. 3]. What is interesting is that the network doesn’t grow proportional to the square of the users but to n^(1.43). This is in line with the Zhang et al. study reported with bitcoin’s growth exponent being n^(1.69). This is because not everyone in the network is connected to each other and the network is more like a cellular network of collections of nodes with collections of users connected to each other. The complete Metcalfe formula was found to be: 绘制市值与每日活跃用户的关系图显示了对数关系的线性关系,可与基于梅特卡夫定律的公式拟合[图3]。有趣的是,网络不会与用户的平方成比例增长,而是与n ^(1.43)成比例。 这符合Zhang等人的观点。研究报告比特币的增长指数为n ^(1.69)。这是因为并非网络中的每个人都彼此连接,并且网络更像是具有彼此连接的用户的节点集合的蜂窝网络。 完整的梅特卡夫公式是: When the market cap vs active user data is fit with a line formulated with the above Metcalfe’s law, we see the same correlation between relative position of a collection of points and the over or under valuation that lead to drastic market movement [Fig. 3]. First we can see that the network was valued over what would be expected from number of active users until late 2016. At this point the network was growing faster than the market cap which lead into the large summer of 2017 spike in price where the data shows points on the top side of the line indicating over-valuation. What is interesting to me is the fact that the network grew so fast in late 2017 and through 2018 which has yet to be reflected in the market cap. The 2018 bubble which is seen in bitcoin is not as present in Ethereum. 当市值与活跃用户数据符合上述梅特卡夫定律的线时,我们看到点集合的相对位置与导致市场剧烈波动的估值过高或过低之间存在相同的相关性[图3]。首先,我们可以看到该网络的价值超过了2016年底之前活跃用户数量的预期。此时网络的增长速度超过市场上限,导致2017年夏季大幅上涨,数据显示该行顶部的点表示估值过高。有趣的是,2017年末和2018年网络增长如此之快,尚未反映在市值上。在比特币中看到的2018年泡沫并不会发生在以太坊上。 Fig. 3 Ethereum market capitalization versus the number of active daily users of the network, in logarithmic scales. The Metcalfe’s function model in orange. Times of bubbles and crashes distinctly shown by data position relative to the Metcalfe function. 图3以太币市值与网络中活跃的每日用户数量,以对数标度表示。梅特卡夫功能模型为橙色。 梅特卡夫函数数据位置清楚地显示出泡沫和崩溃的时间。 INT Going back to the core of Metcalfe’s law which states the network value is proportional to the square of users, how would this apply to an IoT network, where every user could potentially have multiple devices connected to the network? If the number of active users grow similar to a netoid function shape, which we see in Ethereum [Fig. 4] and NEO [Fig. 5], then this would have an effect on the steepness and height of the exponential portion of the curve before leveling off. 回到梅特卡夫定律的核心,该定律表明网络价值与用户的平方成正比,这将如何应用于物联网网络,而其中的每个用户可能有多个连接到网络的设备?如果活跃用户的数量增长类似于netoid函数形状,正如图4所示的以太坊和图5所示的NEO,那么这会在平整之前对曲线的指数部分的陡度和高度产生影响。 Fig. 4 Ethereum Address Growth (Etherscan.io) 图4以太坊地址增长趋势(Etherscan.io) Since no IoT network is developed enough with sufficient device participation to make a model of, we will have to make some assumptions around impacting variables and develop a model based upon them. What do we know? INT is a Chinese project with a minimal amount of communication, lesser still to the western world, developing something that currently has no competing architecture for the given application, which has yet to release a main net and is not yet on any major US accessible exchanges. This all takes me back to NEO, when people had to translate what little information was out there about a project that’s only (only) competition was Ethereum that fit a niche in China’s market. 由于不存在这样的物联网网络,具备充足的参与制定模型的物联网设备,我们将不得不围绕影响变量做出一些假设并基于它们开发模型。 我们目前了解到的是什么呢?INT是一个中国项目,与外界沟通少,尤其是与西方世界,开发的东西目前没有固定应用程序的竞争架构,尚未发布主网,也并未上任何美国主要交易所。 这一切都让我想到了NEO,当时人们从少量信息中只能得知出以太坊是其唯一的竞争者,而且在中国市场占有一席之地。 Understanding that the cryptoeconomy is in much a different place than it was then, with many more investors involved and many ideals changed, the impact or growth of these variables may be different. Hype may have less impact, FOMO may not occur, or actual technical ability may have no impact on valuation and communication and hype may create all value, that much we cannot determine. So for this exercise, let’s assume the growth of this network is similar to that of NEO. NEO’s network is currently 1/35th that of Ethereum at just over 1,000,000 addresses with an average daily activity of even less (1/100th of Ethereum’s daily activity) [Fig. 5]. 如今加密经济的解读与当时的情况是大不相同的,随着更多投资者的参与和想法的转变,这些变量的影响或增长可能会有所不同。炒作影响力可能会被削弱,也可能不会再发生FOMO(Fear of missing out担心错过重大事件)的情况了,或者另一种情况是,实际技术能力可能对估值和沟通没有影响,而炒作了创造所有价值,这些是我们无法确定的。所以对于该实验来说,让我们来假设该网络的增长与NEO的增长相似。 NEO的网络目前是以太坊的1/35,只有超过1,000,000个地址,平均每日活动甚至更少(只有以太坊每日活动的1/100)[图5]。 Fig. 5 NEO address growth (neodepot.org) 图5 NEO地址增长趋势(neodepot.org) Unfortunately, we don’t have address creation history for INT since it is still an ERC-20 token but we do know that there is currently ~80,000 addresses holding INT. Looking at NEO’s address creation chart, this corresponds to August 2017 when Antshares re-branded to NEO and when NEO’s main net had already been live for almost a year. That kind of highlights the difference between the cryptoeconomy of one year ago and now. Based on this, I don’t think it is fair to compare where INT is now to where NEO was when it had this many addresses. Instead, lets use the percentage growth seen after Antshares re-brand as what may happen when INT releases main net and gets on a bigger exchange (4Q 2018). Looking at current unique address activity, averaging ~50–100 addresses a day, this pushes back the timeline to about March 2017. I feel like this is more fair to the timeline of INT’s development and what they have coming in the latter part of this year. INT will also not likely see the spike from a re-brand compounded with NEO’s 2017 run up but that growth may be seen on INT’s main net launch so we will match up the timeline there. I know we are really compounding our error bars here by making so many assumptions but what the heck. 很遗憾,我们没有INT的地址创建历史,因为它仍然属于ERC-20代币,但我们知道目前有大约80,000个地址持有INT。 看看NEO的地址创建图表,这相当于2017年8月小蚁重新命名为NEO,而NEO的主网已经存在了将近一年。这种情况凸显了一年前和现在的加密经济之间的差异。 因此,我认为将现在的INT与当时已经拥有许多地址的NEO来进行比较并不公平。相反地,我们更应该将重新命名之后NEO百分比的增长与INT发布主网后并进入更大的交易所时(2018年第4季度)所产生的增长来比较。来看一下当前地址活跃度,平均每天约50-100个地址,这将时间线推迟到2017年3月左右。我觉得这对INT的发展时间表更加公平,以及INT在今年下半年的发展计划。从2017年NEO的重新建立其品牌后的竞争结果来看,目前也不太可能看见INT价格的猛增,但在INT的主网发布后,这种增长由可能会实现,因此我们将在那里匹配时间表。我知道我们是在通过做各种的假设来复合误差线,但是管它呢! In doing so we get an INT-NEO proportionality that we can apply to NEO’s active address history and model a potential INT network activity into the future. This gives us predicted network activity out ~1.5 years to March 2020. In order to use this to find INT’s proposed market cap correlation to this predicted network activity, we have to first find the Metcalfe coefficient (the slope of the line) to NEO’s dataset and renormalize it to INT’s starting point market cap. This gives us a Metcalfe function similar to that of Ethereum of: 如此一来,我们得到了INT-NEO比例,可以将其应用于NEO的活动地址历史记录,并为未来的潜在INT网络活动建模。这使我们预测的网络活动可以从1.5年前追溯到2020年3月。 为了通过该模型来找到INT提出的市场上限与此预测网络活动的相关性,我们必须首先找到NEO数据集的梅特卡夫系数(线的斜率)并将其重新规范化为INT的起点市值。这为我们提供了类似于以太坊的梅特卡夫功能: You can see that the slope of this line is MUCH higher than Ethereum. I believe this is because of the age of speculation that we are in that drives value without real world usage. This basically means that every user adds more value to the network than a user on Ethereum. Now this may be true for a data based network as in IoT, where the users are not just transacting value exchange but are also transacting data that may have value. Applying this formula to INT’s predicted dataset, we get: 我们发现这条线的斜率比以太坊高很多。我想这是因为我们的猜测是基于没有真实使用的情况下的价值推动。这基本上意味着每个用户都比以太网上的用户增加的网络价值还要多。现在,对于像物联网这样的基于数据的网络来说,这可能是正确的,其中用户不仅进行交易价值交换,而且还交易可能具有价值的数据。 将此公式应用于INT的预测数据集,我们得到: Fig. 6 INT predicted market capitalization versus predicted active users, in logarithmic scales, based on NEO’s historical growth renormalized to INT’s current active user state and coming timeline of events. The orange line is the best fit Metcalfe’s formula. 图6 INT基于NEO的历史增长重新归一化为INT的当前活动用户状态和即将到来的事件时间线,以对数尺度预测市场资本化与预测活跃用户。 橙色线最符合梅特卡夫公式。 So where does that leave us? What price at what time? We can use the above Metcalfe’s formula to predict the market cap at a given time [Fig. 7]. 那么我们可以得出什么呢?对应的时间对应着什么价格呢?我们可以使用上面的梅特卡夫公式预测固定时间的市值[图7]。 Fig. 7 INT predicted market capitalization and corresponding price in USD based on NEO’s historical growth renormalized to INT’s current active user state and coming timeline of events. 图7 根据NEO的历史增长,INT预测市场资本化和相应的美元价格,重新归结为INT目前的活跃用户状态和即将到来的事件时间表。 This data shows INT at $10 around January 2019 and oscillating between there and $15 before a big run up in the summer of 2019, peaking at $50 before consolidating back down to the ~$20 level. Now this is totally and absolutely a collection of guesses and estimates with a healthy dose of speculation but it is modeled on real world data and fit to a valuation formula that is proven to accurately predict network value based on number of users. This might even be an underestimate based on the fact an IoT network may have more immediate real world use (and therefore higher user growth) than a smart contract based network real world adoption. INT has already specified several projects and partnerships that will drive that use. This also assumes: 这一数据显示,2019年1月左右的INT价格为10美元,在2019年夏季大幅上涨之前在那里和15美元之间波动,最终价格达到50美元,然后再回到20美元左右。 目前这完完全全只是一种猜测,但是具有健康的投机剂量,以现实世界数据为模型,并且符合估值公式,该公式已被证明可以根据用户数准确预测网络价值。也有可能低估了INT未来潜力,毕竟基于物联网网络可能比基于智能合约的网络拥有更直接的现实场景的应用(因此能实现更高的用户增长)。而INT已经明确公布了一些项目和合作伙伴,利于推动应用发展。 同时假设: INT will have no major market growth before main net release. This would change the starting point for all growth and shift the pattern up. The circulating supply which determines the price is held steady at 300 million throughout. If we assume that number becomes larger in the 1.5 year timeline shown, that may have some impact on overall price. The user activity will grow regardless of market conditions. Basically stating that this network will have more real world usage that will drive network activity, not just the speculative buying and selling activity. This adds another variable to growth independent of market speculation. This implies that even in market slumps, the value of the network will rise. AND THE BIG ONE. The overall market growth in the coming year is going to have the same cycle like what was seen in late 2017. This correlates to the spike shown in mid-2019 in the above chart and was reflected in the network activity in active users. If this does not happen, active user count will still continue to grow and drive the market price, continuing to be proportional to the active users in a more linear fashion instead of the spike shown. INT在主网上线前没有重大的市场增长。否则将改变所有增长的起点与其增长模式。 确定价格的流通供应始终保持在3亿。如果我们假设该数字在所示的1.5年时间线内增加,则可能对整体价格产生一些影响。 无论市场条件如何,用户活跃度都将增长。基本而言,这个网络将有更多的现实场景的应用,利于推动网络活跃度,而不仅仅是投机性的买卖活动。这增加了另一个增长变量,与市场投机无关。这意味着即使在市场暴跌中,网络的价值也会上升。 最重要的一点:未来一年的整体市场增长将与2017年末的情况相同。这与上图中2019年中期的峰值相关,并反映在活跃用户的网络活动中。如果该情况无法发生,活跃用户数仍将继续增长并推动市场价格,继续以更线性的方式与活跃用户成比例,而非如图中峰值所示。 I will continue to track this user growth through main net release and market expansion and release updates on how the real world data reflects this model. Based on the partnerships currently underway with INT and the data that is available from other projects, network growth is bound to occur and the number of active addresses will reflect that, maybe more so than what was shown in NEO. Even if we assume a slower growth and a much less steep network activity to market cap relation like that of Ethereum, $10 INT is more of a “when” instead of an “if”. You can go much deeper into this analysis by fully modeling network growth and taking into account number of active users and daily transaction volume. To have a more in-depth look at this method, read these articles and papers: 我将继续通过主网上线和市场扩展来跟踪用户增长,并发布有关现实世界数据如何反映此模型的更新。根据目前正在进行的INT合作项目以及其他项目提供的数据显示,网络增长势必会发生,可通过活跃地址的数量反映出来,这可能比NEO中显示的更多。即使我们假设网络活动增长较慢,而且网络活跃度低于以太坊,但是10美元的INT更像是“何时”,而不是“如果”。 你可以通过对网络增长的完全建模,同时考虑活跃用户数和每日交易量来更深入地了解此分析。 如果想要更深入地了解该方法,以下文章和论文会有所帮助。 References 参考文章 https://link.springer.com/article/10.1007%2Fs11390-015-1518-1 https://arxiv.org/pdf/1803.05663.pdf https://medium.com/mit-technology-review/how-network-theory-predicts-the-value-of-bitcoin-664b701740a5 https://medium.com/@clearblocks/valuing-bitcoin-and-ethereum-with-metcalfes-law-aaa743f469f6 https://medium.com/cryptolab/network-value-to-metcalfe-nvm-ratio-fd59ca3add76


原文转载:https://medium.com/int-chain/theoretical-value-of-int-metcalfes-law-1909030b284b

最新回复